These dashboards represent far more than data visualization - they capture the evolution of facility intelligence itself.
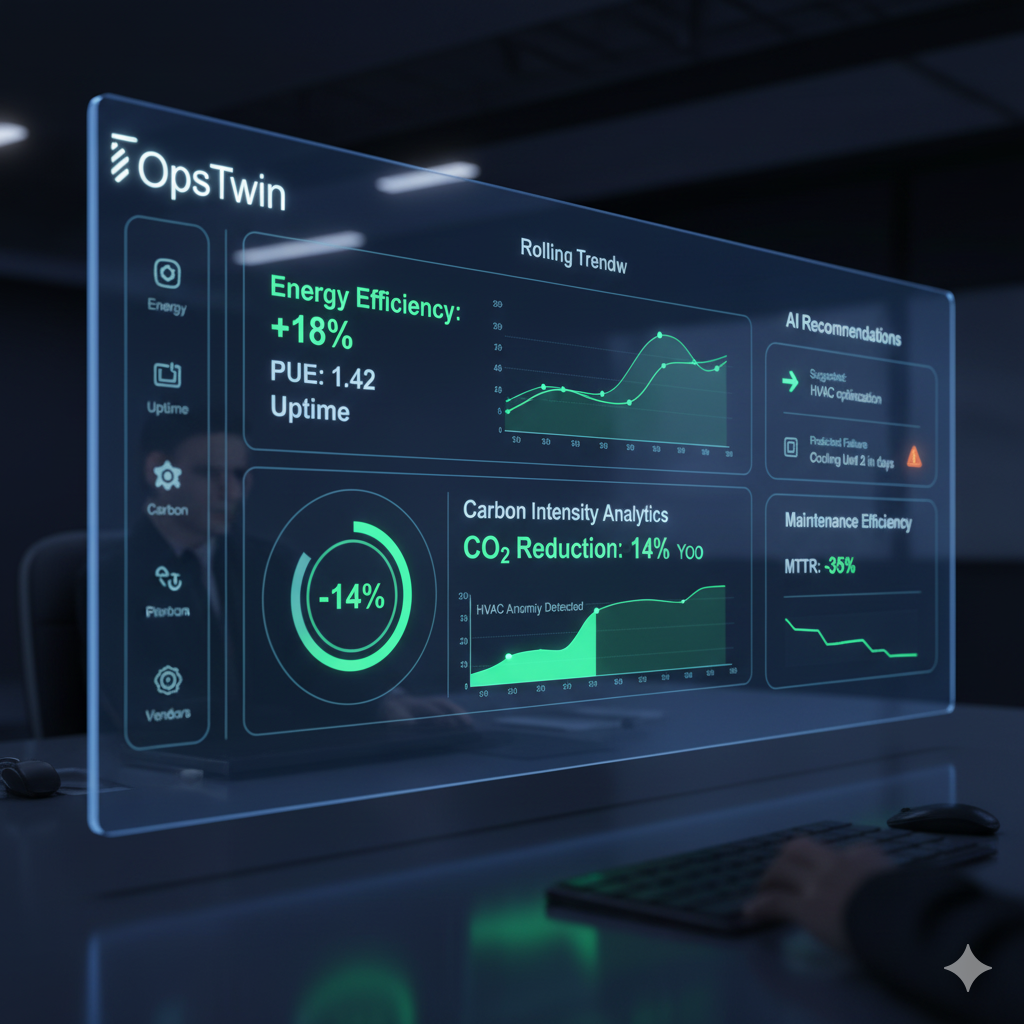
Every pixel on this screen reflects how OpsTwin’s core modules - EnergyAnalytics,
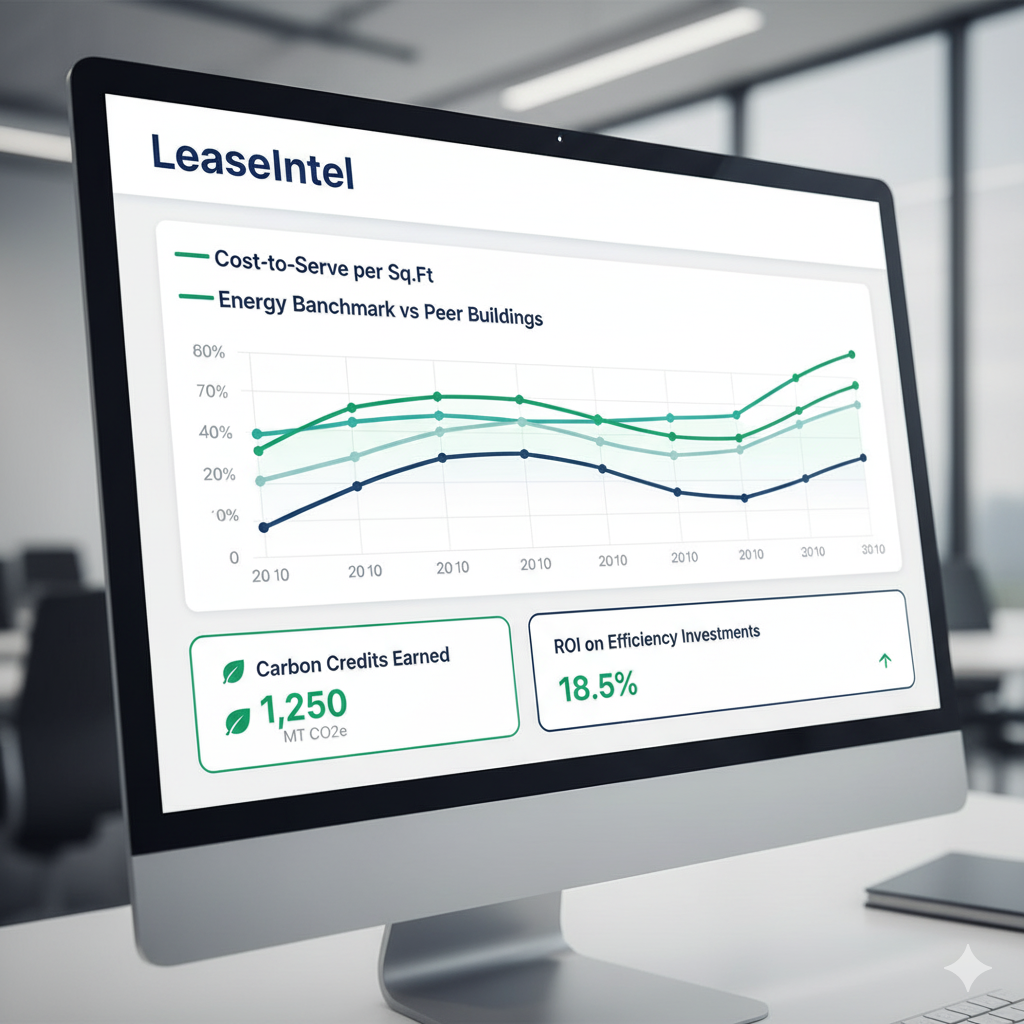
LeaseIntel, and
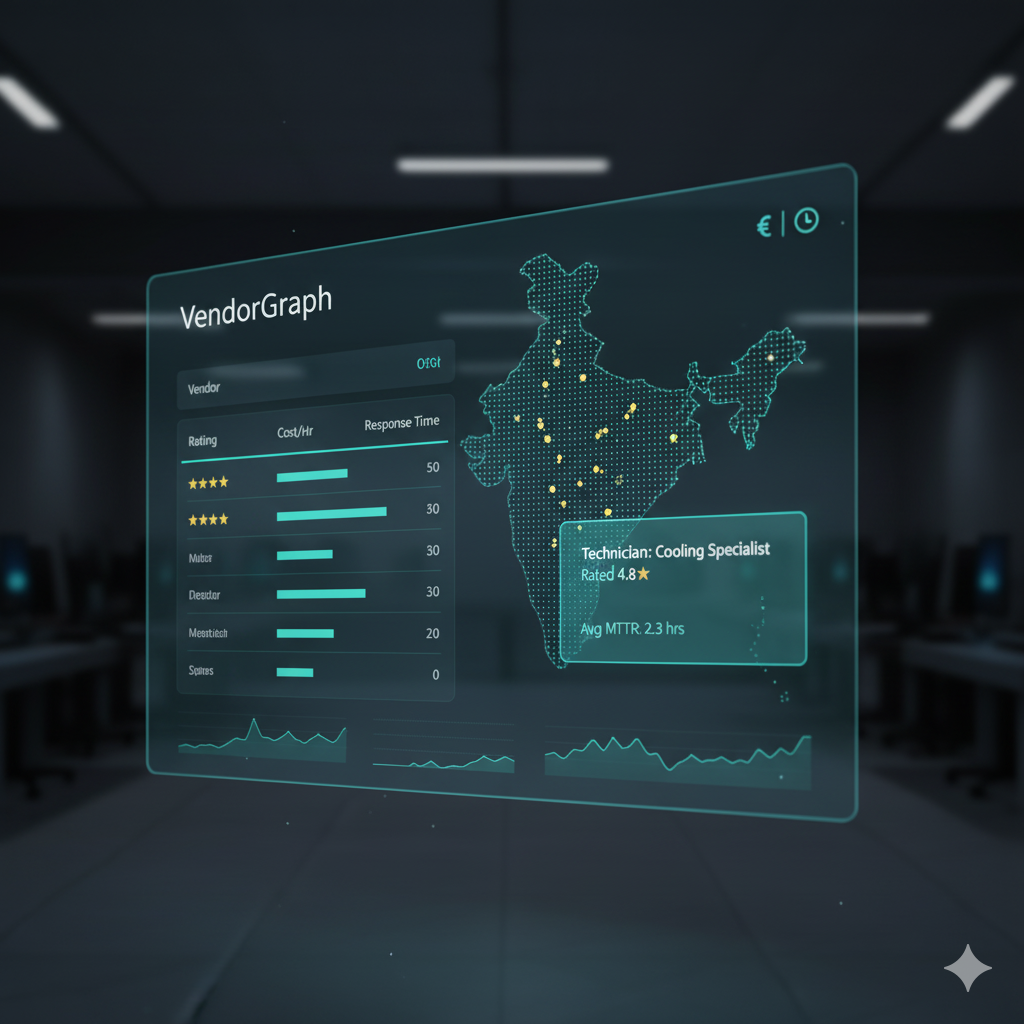
VendorGraph -
work together in real time to transform operations from reactive maintenance to predictive mastery.
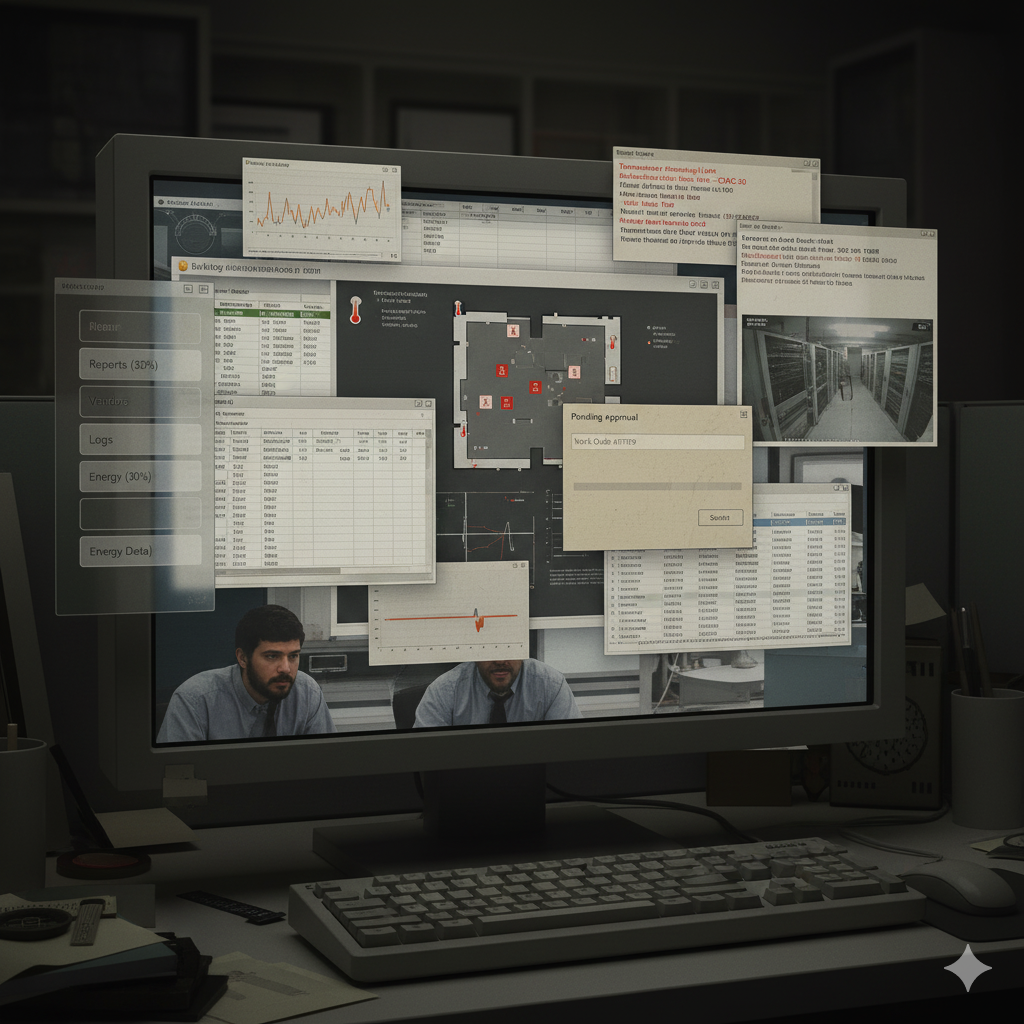
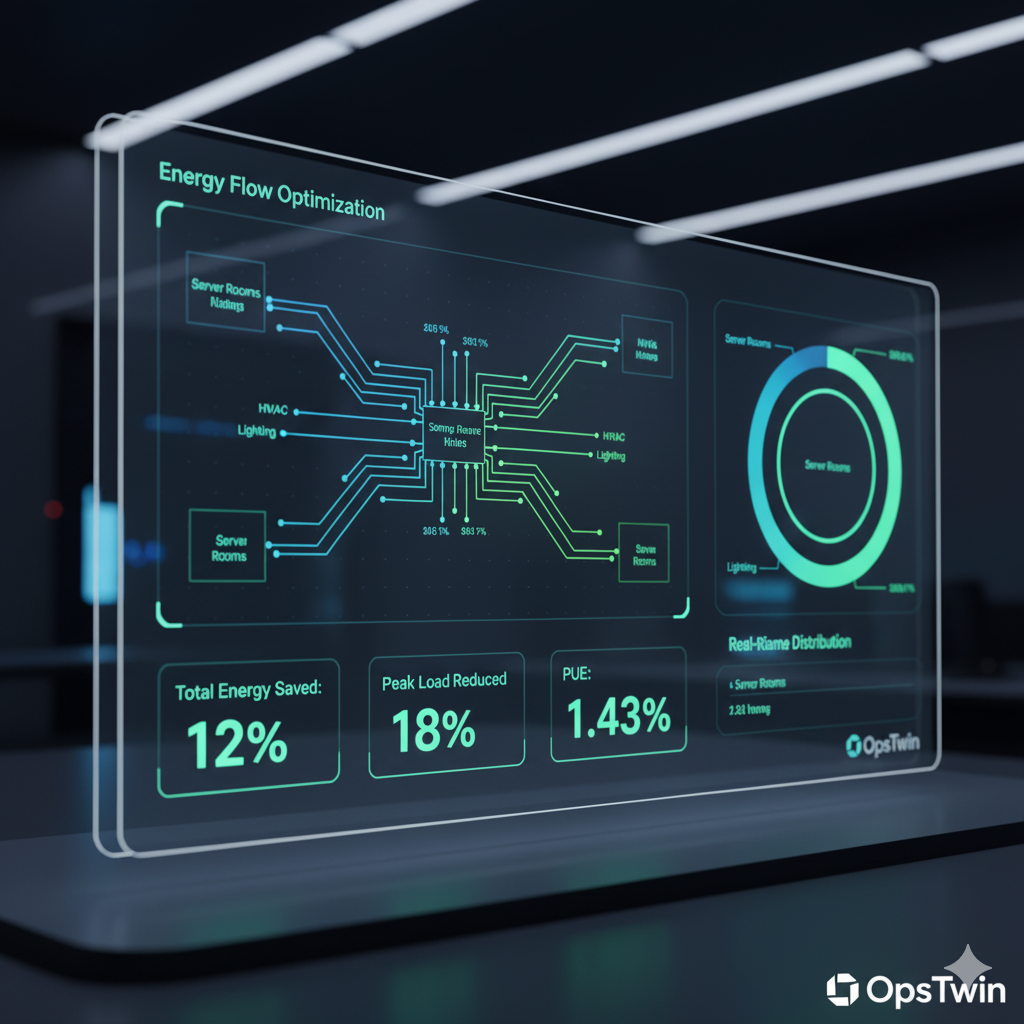
On the left, you see the chaos that most facilities face today - fragmented systems, inconsistent metrics, and teams drowning in reports that arrive days too late.
On the right, OpsTwin brings clarity: unified telemetry from HVAC, energy meters, occupancy sensors, and vendor data flowing into one adaptive command center.
Here, every insight is traceable, every recommendation is backed by machine learning, and every improvement is verified through immutable logs and third-party assurance.
From predicting energy overconsumption events with 92% accuracy to mapping vendor reliability using trust scores,
OpsTwin’s intelligence continuously learns from each action and feedback loop.
The system doesn’t just flag problems - it forecasts failures, recommends optimal interventions, and quantifies their financial and environmental impact.
Each building becomes smarter with time, fine-tuning its performance around uptime, carbon efficiency, and cost-to-serve targets.
For leadership teams, these dashboards are more than numbers - they are living proof of accountability.
Instead of relying on assumptions or manual audits, clients now receive evidence-based performance reports that are auditor-ready and renewal-friendly.
For operations managers, they mean fewer escalations and faster turnarounds.
For vendors, a transparent ecosystem where reliability is measurable and rewarded.
Together, these modules form the neural network of OpsTwin - an AI-driven ecosystem that transforms buildings into intelligent, self-optimizing assets.
The result: zero ambiguity, measurable ROI, and a new era of outcome-based operations in commercial real estate.